
It has now been 2.5 years since Universal Analytics closed its doors and we were more or less “forced” to say hello to Google Analytics 4. It was a major transition for all of us, with new concepts, new navigation, and a different way of thinking about data. Even though GA4 has been around for quite some time, we find that many people still struggle to find what they are looking for. Where do you find the basic statistics? How do you see traffic, which pages perform best, or how users behave?
That is exactly why we have put together this guide to Google Analytics 4. The purpose is to help you get started with GA4 without drowning in advanced reports and technical terminology. Here, we focus on the basic information that most website owners and/or e-commerce managers actually need in their day-to-day work and show you where to find it in GA4.
📑 The guide works as a practical reference. If you are looking for something specific, you can easily use your browser’s search function (Ctrl / Command + F) and jump directly to the right section.
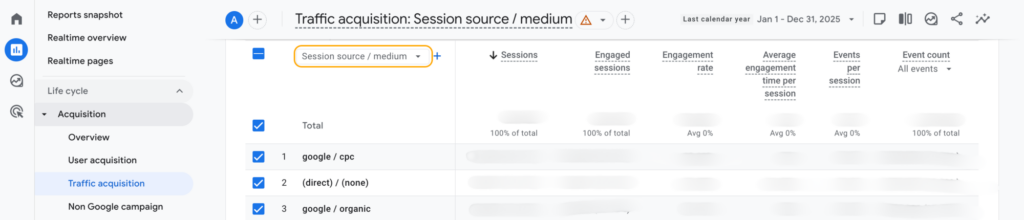
Traffic acquisition
Here you will find a lot of relevant and useful data. Sometimes, this is the only place you need to go. The report shows data for both new and returning users, which differs from “User acquisition,” which only shows new users.
How to get there →
- Click “Reports” in the left-hand menu
- Select “Acquisition”
- Then “Traffic acquisition”
🔍 Can’t find Traffic acquisition under “Acquisition”? It may be located elsewhere in your menu.
🔍 Don’t see Traffic acquisition in your menu at all? You may need to add it. This can easily be done by following the relevant steps.
What can you find here?
Sessions – This is the number of sessions started on the website, in other words, your traffic.
You can view data from different sources, depending on what is most relevant to you. I work with SEO and primarily Google, so I usually select “Session source/medium” and then look at “Google Organic,” meaning organic traffic from Google.
Click around among the different options and find the one that best matches your needs.
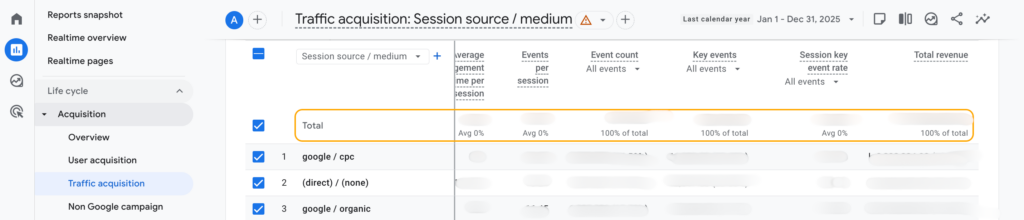
Revenue – In this section of GA4, you can also see revenue. If you do not sell anything, as in our case, this will be empty. What is shown here is revenue from purchases, advertising, and any subscriptions.
- Total revenue – See the total amount next to “Total.”
- Revenue per channel – Select “Session source/medium” to see, for example, organic traffic from Google or Google Ads. Select “Default channel group” to see total revenue per channel group.
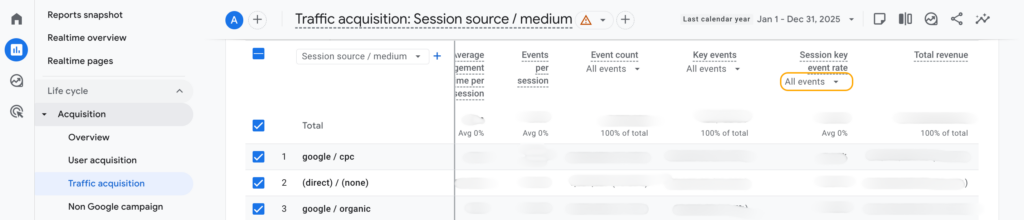
Conversion rate – You can also find the conversion rate here.
- Scroll all the way to the right and look under “Session key event rate.” This shows the number of sessions in which a key event (conversion) occurred.
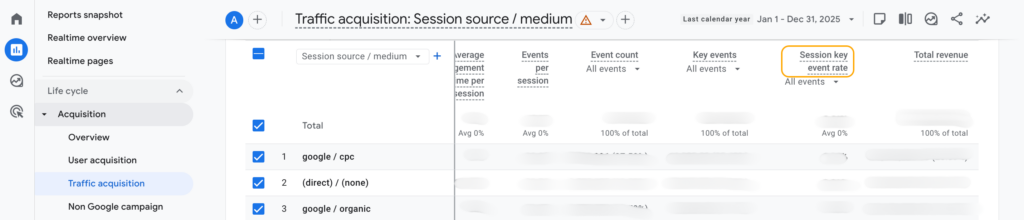
- You can then filter by specific key events (conversions).
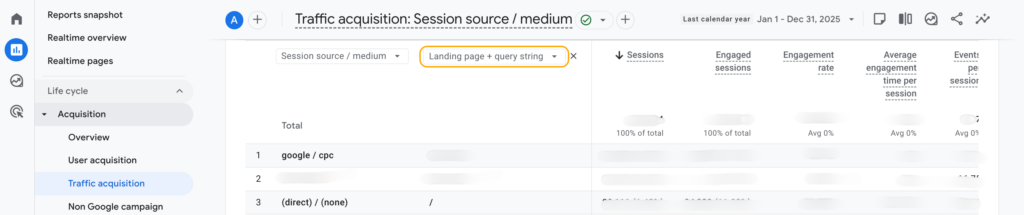
Filters – There are many ways to filter the data in the Traffic acquisition report.
- Landing page – One useful filter is by landing page. This allows you to see data such as traffic and revenue for a specific page.
- Device category – Another valuable filter is “Device category,” which lets you view data split by mobile, desktop, and tablet.
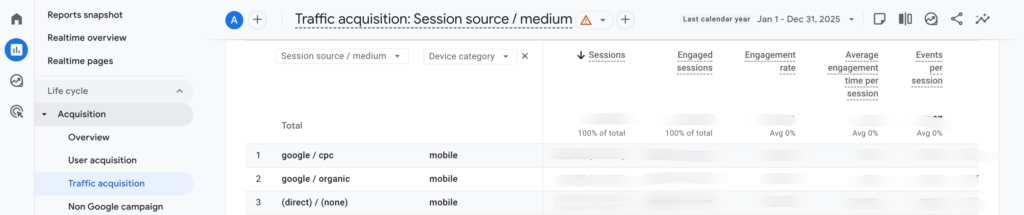
Browse through the available filter options to find what is most relevant for you.
Engagement
In the Engagement reports, you will find clear and specific reports related to engagement, that is, how visitors behave on the website and what actions they take.
How to get there →
- Click “Reports” in the left-hand menu
- Select “Engagement”
- Choose one of the four options, depending on what you want to see:
What can you find here?
- Overview – A general overview report
- Events – View data for specific events
- Pages and screens – See data about the pages and screens users visit, whether it is the first page they visit or a page they visit later during the session
- Landing page – The first page a user visits in a session
Purchase journey
Analyzing your visitors’ purchase journey is extremely useful, as it gives insight into how many users drop off and where. This allows you to improve steps in the funnel that do not meet expectations.
Finding purchase journey data in GA4 is actually very simple.
How to get there →
- Click “Reports” in the left-hand menu
- Select “Monetization”
- Then “Purchase journey”
What can you find here?
First, you see the funnel itself. It is fairly easy to understand and self-explanatory, but we clarify it below.
- Session start – Step 1 is the number of users who started a session, meaning users who interacted with the site by viewing at least one page.
- View product – Step 2 includes users who viewed a product. From here, users are divided into two groups: those who leave and those who move on to…
- Add to cart – Users who add at least one product to the cart continue to step 3.
- Begin checkout – These users do not necessarily complete a purchase; something in the checkout may cause them to reconsider.
- Purchase – The final step shows the number or percentage of users who completed the entire journey, from session start to purchase.
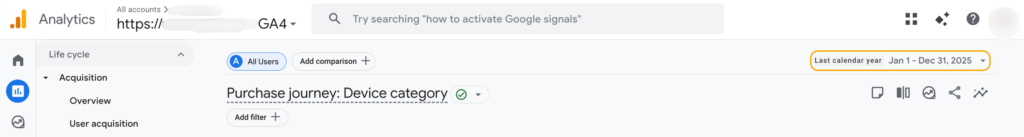
Filters – The second part of the report looks like this.
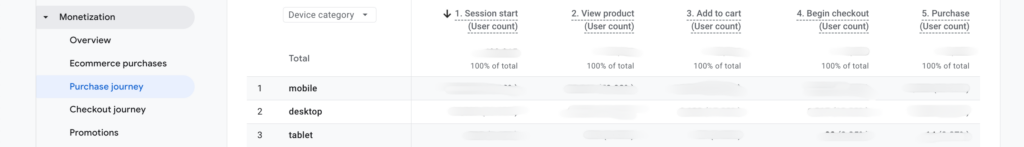
Here, you can use different filters to view the data from different perspectives. In the example, the data is split by device category: mobile, desktop, and tablet.
There are several other options, such as viewing the purchase journey by country or browser. Choose a filter by clicking the filter-button.
Date – Of course, you can also adjust the date range, just like in all other reports. This is done at the top of the report.
The tricky part of the purchase journey is not finding the data, but understanding it and drawing conclusions. Why do a certain number of visitors drop off in the checkout, for example? For e-commerce businesses, this is crucial to investigate, as factors like shipping or payment options can be decisive.
Dare to click around
Now we have gone through some important parts of Google Analytics 4, so you can start analyzing your data in a structured way right away. The reports we have covered are used daily in ongoing analysis work and provide a solid foundation for understanding how a website is actually performing. In other words, by getting to know these reports, you will go a long way.
The most important advice is simple: dare to click around. Try different reports, familiarize yourself with the menus, and use Google’s own Analytics Help when something feels unclear. The more time you spend understanding the tool, the more value you will get from it. The first step toward better results and reaching your goals in 2026 is understanding what works and what does not.
Good luck!
