

In today’s article, we have chosen to take a closer look at Google’s new site speed reporting feature in Google Search Console. In this text, you will briefly learn where to find the report, its valuable use cases, and its current status.
That site speed has become an important ranking signal in Google’s eyes is something more and more site owners have become aware of over the past year.
Typically, free tools and/or free versions of measurement tools such as Google PageSpeed Insights, Pingdom Website Speed Test, and GTMetrix are used to identify potential issues as well as various opportunities for improvement.
However, there is one area where all of these tools fall short: providing a clear, comprehensive overview of a site’s overall speed and where potential shortcomings exist.
This often leads to an unnecessarily time-consuming process for many webmasters, where page after page is checked individually.
Fortunately, this process is about to become significantly easier for everyone, thanks to a new report in Google Search Console.
Google launches a speed report in Google Search Console
At the time of writing, Google has already rolled out its new speed report in Google Search Console. The results are based on anonymized data collected from real user visits to the website via the Google Chrome browser.
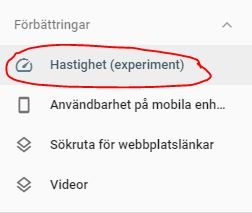
You can find the report by logging in to Google Search Console, selecting the site whose speed you want to review, and then clicking on “Speed” under “Enhancements.”
The new report allows you to review all of your site’s pages from a speed perspective, both on mobile and desktop.
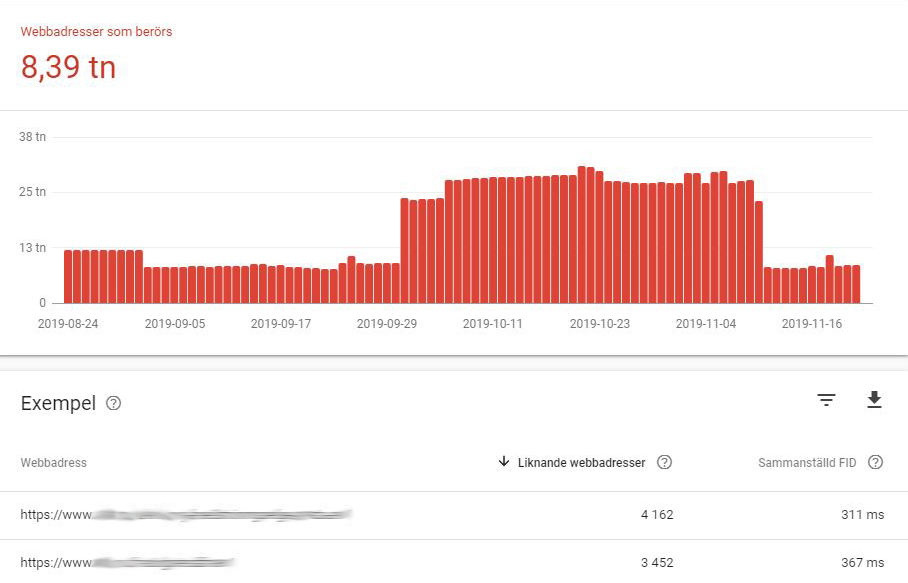
Getting an overview of the number of high- and low-performing pages over time is a simple task, as illustrated in the image below.
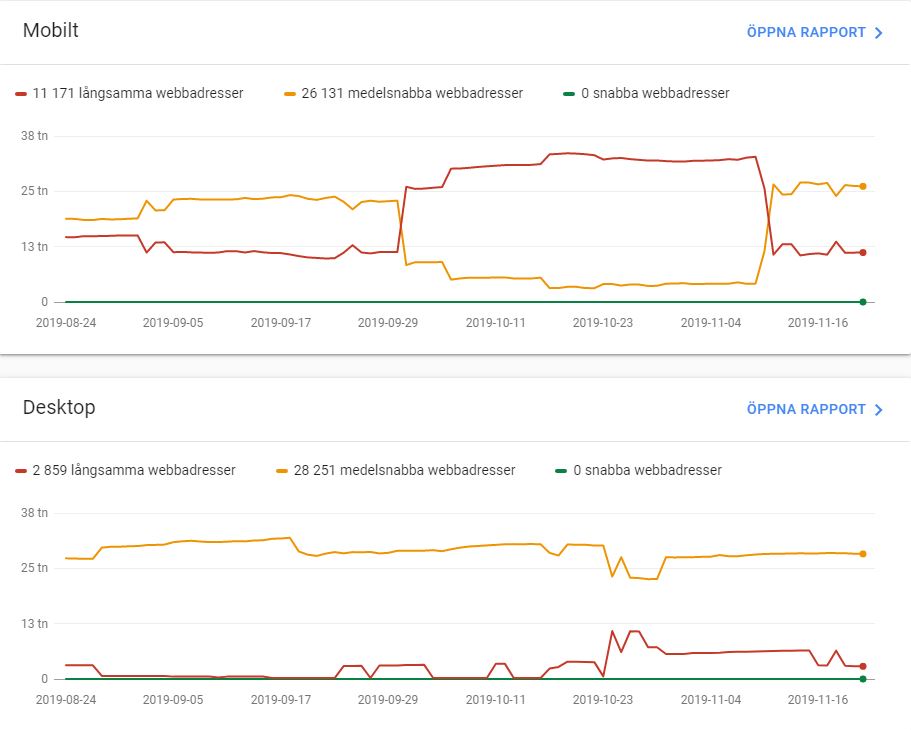
This is valuable for several reasons. In addition to providing an overall picture, it can help you identify whether specific implementations and changes have had a clearly positive or negative impact on site speed.
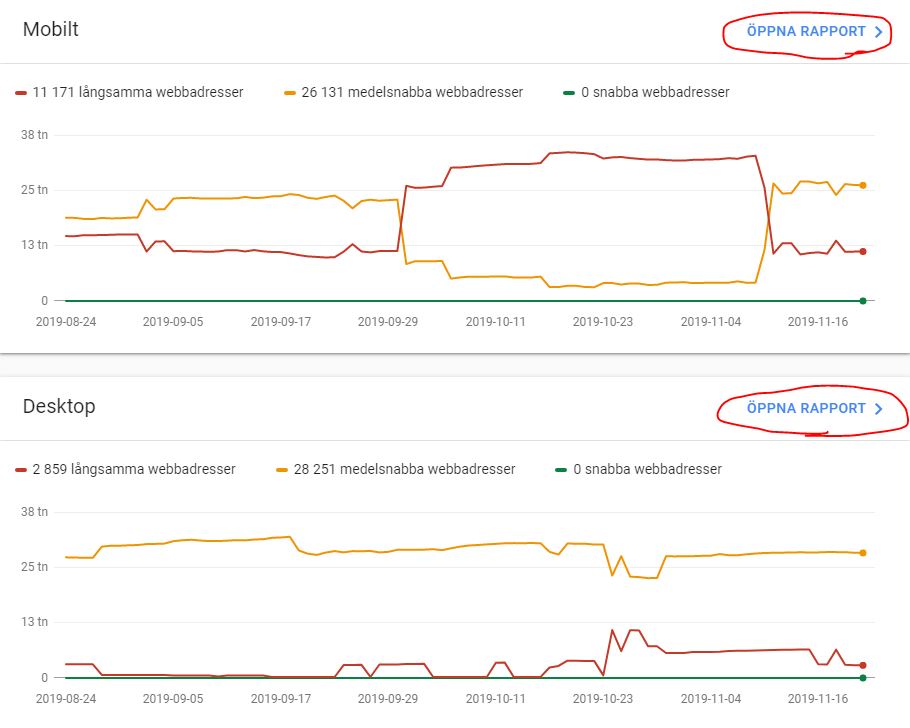
To view data for individual URLs, simply click “Open report” in the top-right corner for either “Mobile” or “Desktop,” and then click on one of the lines under “Details.”
Step 1.
Step 2.
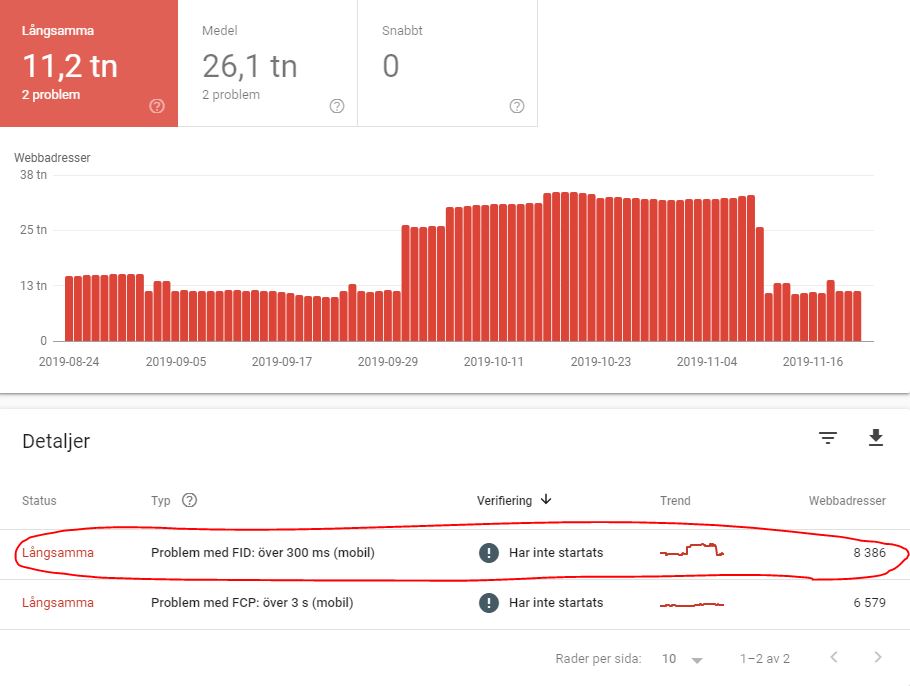
This opens a view where you can see which URLs are included, along with their respective values for either FID or FCP (depending on what you have chosen to analyze).
FID stands for “first input delay” and measures how long it takes before a page responds to a user’s first interaction.
FCP stands for “first contentful paint” and measures how long it takes before a page begins to render content.
NOTE! It is worth noting that the new report is still in an experimental phase, which means that it currently has some limitations in terms of functionality and data. That said, it is unlikely to be long before an official launch, at which point you will be able to fully benefit from this new feature.
